

"Purity: 99.6% (HPLC)." Lines like this appear on certificates of analysis everywhere, and most buyers read them as a simple score. The number is real, but it is also the output of a specific method with specific limits. Knowing how high-performance liquid chromatography works, what a chromatogram shows and what "area percent" actually measures will help you read a purity figure for what it is: useful, precise within its scope, and not the whole story.
This guide builds on our page on how to read a certificate of analysis, which covers the document as a whole. Here we zoom in on one line.
What HPLC is
High-performance liquid chromatography (HPLC) is a laboratory technique that separates the components of a mixture so they can be detected and measured one by one. It is one of the most widely used methods in pharmaceutical and chemical quality control, and its general principles are described in pharmacopoeial chapters such as USP General Chapter <621> "Chromatography." A harmonized version of that chapter, agreed through the Pharmacopeial Discussion Group, became official on 1 December 2022.
The basic setup
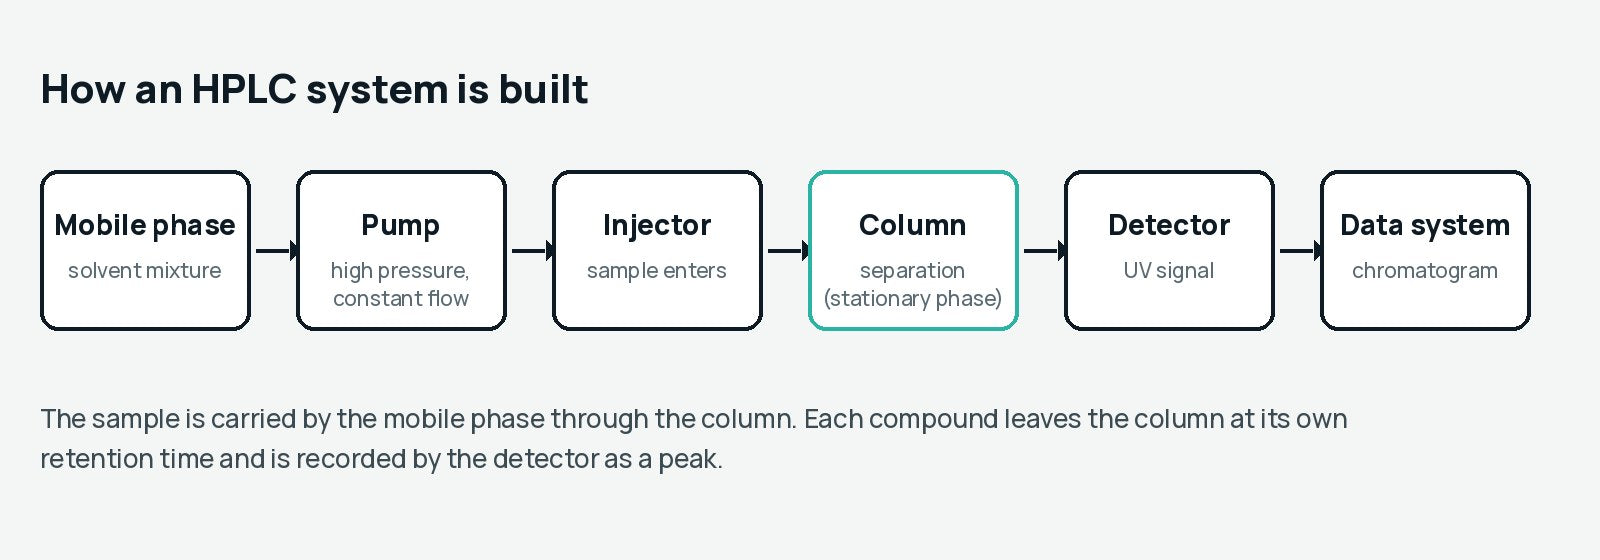
An HPLC system has five main parts:
- Mobile phase: a liquid, usually a mixture of water or buffer and an organic solvent, pumped continuously through the system.
- Pump: delivers the mobile phase at high pressure and a constant flow rate.
- Injector: introduces a small, precisely measured volume of the dissolved sample into the flowing mobile phase.
- Column: a steel tube packed with fine particles, called the stationary phase. This is where separation happens.
- Detector: records a signal as each separated component leaves the column. Ultraviolet (UV) absorbance detectors are the most common.
How separation works
Each compound in the sample interacts with the stationary phase to a different degree. Compounds that interact weakly travel through the column quickly; compounds that interact strongly are held back longer. The time a compound takes to travel from injection to the detector is its retention time. Under fixed conditions (same column, mobile phase, flow rate and temperature), a given compound elutes at a reproducible retention time.
Reading a chromatogram
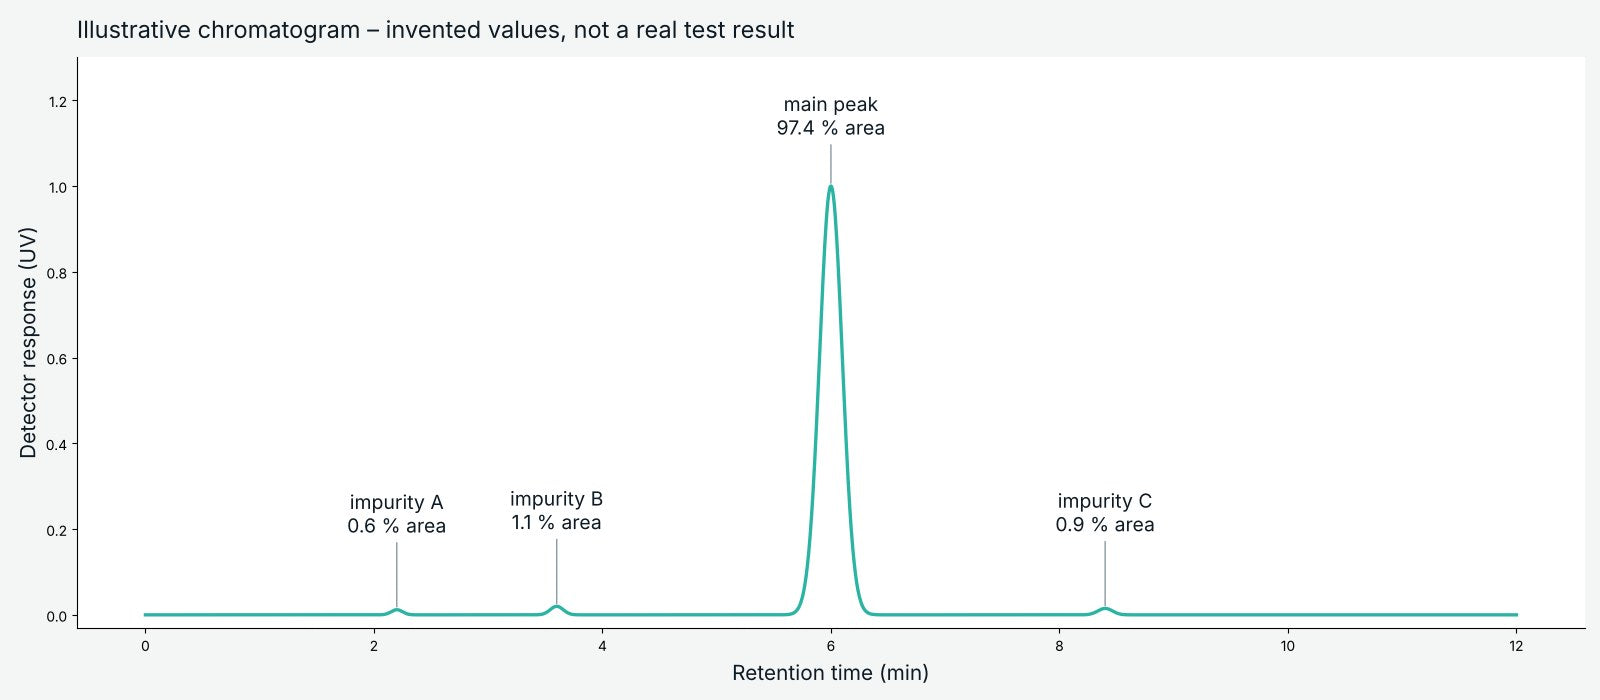
The detector output is plotted as a chromatogram: a line graph with time on the horizontal axis and detector response on the vertical axis.
- Baseline: the flat line recorded when nothing but mobile phase is passing the detector.
- Peaks: rises and falls in the signal as each compound passes the detector. Each peak corresponds to one or more compounds eluting at that time.
- Main peak: the large peak from the substance being tested.
- Minor peaks: smaller peaks before or after the main peak, typically impurities, degradation products or artifacts from the sample solvent.
- Peak area: the area between the peak and the baseline. Data software integrates this area, and it is the quantity used for calculations.
A chromatogram attached to a certificate is valuable because it lets you see what the single purity number summarizes: how many peaks were detected, how large they were and how well they were separated.
What "area percent" means
The most common way to express HPLC purity is area percent (also called area normalization). The calculation is simple:
Area % of main peak = (area of main peak ÷ sum of all integrated peak areas) × 100
If the main peak has an area of 996 units and all the minor peaks together add up to 4 units, the area percent purity is 996 ÷ 1,000 × 100 = 99.6%.
The appeal is obvious: no extra calibration is needed, and the result is easy to communicate. But the simplicity hides several assumptions.
The limits of an area percent number
1. It only counts what the detector sees
A UV detector responds to compounds that absorb light at the chosen wavelength. Substances that absorb weakly or not at all at that wavelength produce small peaks or no peaks. Water, many inorganic salts and many residual solvents fall into this group. An area percent of 99.6% means "99.6% of the UV-detected peak area," not "99.6% of the mass in the jar." That is why full certificates often report additional tests, such as water content, residual solvents or heavy metals, using other methods.
2. Different compounds respond differently
Two compounds present in equal amounts do not necessarily produce equal peak areas. Each has its own response factor. The ICH Q3A(R2) guideline on impurities in new drug substances addresses this directly: the drug substance can be used as a standard to estimate impurity levels, but where response factors are not close, a correction factor should be applied, or the method must at least be set up so impurities are overestimated rather than underestimated. Plain area percent assumes all response factors are equal.
3. Peaks can hide behind each other
If an impurity has nearly the same retention time as the main compound, the two can elute together (co-elute) and appear as one peak. The impurity is then counted as part of the main peak. Method developers check for this by verifying resolution, the degree of separation between neighboring peaks. Pharmacopoeial chapters define system suitability parameters such as resolution, peak symmetry and repeatability for exactly this reason.
4. Integration settings matter
Software only integrates peaks above set thresholds. Very small peaks may be ignored, and how the baseline is drawn under a peak affects its area. A well-run laboratory documents its integration parameters as part of the validated method.
5. Mirror-image forms may not separate
Many molecules, phenibut included, are chiral and exist as two mirror-image forms. On a standard (achiral) HPLC column, the two forms behave identically and elute as a single peak. Separating them needs a chiral column or another dedicated method. ICH Q3A explicitly excludes enantiomeric impurities from its scope for this reason; they are handled separately.
6. It describes one sample from one batch
An HPLC result describes the specific sample analyzed. It applies to the batch only insofar as the sample represents that batch. This is why the LOT number on a certificate matters so much; see our article on LOT numbers and traceability.
Area percent vs. assay
Area percent is a relative measure: it compares peaks within the same chromatogram. An assay is an absolute measure: the sample's response is compared with a certified reference standard of known purity, and the result is expressed as a percentage of the claimed content, often on a weight-for-weight basis.
The two numbers answer different questions. Area percent asks: "Of what this method detects, how much is the main compound?" Assay asks: "How much of the main compound is actually in this sample, by weight?" A certificate that states which one it reports is easier to interpret. For a salt such as a hydrochloride, an assay should also state whether it is calculated on the salt or the free form; our article on phenibut HCl vs. FAA explains why that distinction exists.
Identity is not the same as purity
Purity asks how much of the sample is the target compound. Identity asks whether the target compound is the compound it claims to be. HPLC alone is better at the first question than the second.
A matching retention time against a reference standard is supporting evidence of identity, but two different compounds can elute at similar times. For that reason, identity is usually confirmed with methods that provide structural information, such as infrared spectroscopy (IR), mass spectrometry (MS, often coupled to HPLC as LC-MS) or nuclear magnetic resonance spectroscopy (NMR). The ICH Q2(R2) guideline on validating analytical procedures lists specificity, meaning the ability to assess the analyte unequivocally in the presence of other components, among the core characteristics for identity, assay and impurity tests.
Validation: why method details matter
A purity number is only as trustworthy as the method that produced it. ICH Q2(R2), which took legal effect in the EU on 14 June 2024, describes how analytical procedures are validated. Characteristics include specificity, accuracy, precision, detection limit, quantitation limit, linearity and range. A laboratory that has validated its method can show that the method separates the relevant impurities, gives reproducible results and is sensitive enough at the levels that matter.
How small is "small"?
Pharmaceutical quality systems formalize which impurity levels need attention. For typical new drug substances, ICH Q3A(R2) sets a reporting threshold of 0.05% and an identification threshold of 0.10%, with exact values depending on the intended daily intake. These thresholds are written for registered pharmaceutical substances, but they give a useful sense of scale: in a well-characterized material, analysts are tracking individual impurities at the level of hundredths of a percent.
A buyer's checklist for an HPLC result
- Is the method named? "HPLC-UV" with a stated wavelength is more informative than "HPLC" alone.
- Is it area percent or assay? The two measure different things.
- Is a chromatogram attached? It shows what the number summarizes.
- Is identity confirmed separately? Look for IR, MS or NMR results, or an identity test against a reference standard.
- Are other tests reported? Water content, residual solvents and heavy metals cover what UV-based HPLC cannot see.
- Does the LOT match? The certificate must refer to the same LOT number as your container.
- Who ran the test? An independent laboratory, ideally accredited for the method used, adds credibility.
Every product in the Phenilab nootropics collection, including the Phenibut 500 mg capsules, carries a LOT number that ties it to its certificate. If you are new to the category, our beginner's guide explains the basics.
Frequently asked questions
What does "99% purity by HPLC" mean?
Usually it means the main peak makes up 99% of the total integrated peak area in the chromatogram (area percent). It describes what the detector saw under that method, not necessarily 99% of the sample's total mass.
What is the difference between area percent and assay?
Area percent compares peaks within one chromatogram. An assay compares the sample with a certified reference standard and reports actual content, often by weight.
Can HPLC prove the identity of a compound?
A matching retention time supports identity but is not conclusive on its own. Identity is usually confirmed with structural methods such as IR, mass spectrometry or NMR.
Why might a 99.9% HPLC result still miss something?
Substances that do not absorb at the detection wavelength, such as water or many inorganic salts, may not appear. Impurities can also co-elute with the main peak, and standard columns do not separate mirror-image forms.
What is a chromatogram?
It is the graph produced by an HPLC run, showing detector response over time. Each peak represents one or more compounds leaving the column.
Sources
- USP: Notice of adoption of harmonized standard, General Chapter <621> Chromatography
- EMA: ICH Q2(R2) Validation of analytical procedures
- EMA: ICH Q3A(R2) Impurities in new drug substances
- ICH Q3A(R2) guideline text (PDF), EMA
Information in this article is general and is not medical advice.